Jump to content

File:Anthropogenic carbon flows 1850-2018.png

Page contents not supported in other languages.
This is a file from the Wikimedia Commons
From Wikipedia, the free encyclopedia

Original file (2,067 × 2,253 pixels, file size: 157 KB, MIME type: image/png)

Summary

Description
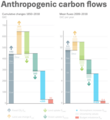
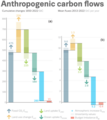
English: This figure shows estimated anthropogenic carbon flows for the Earth system, both as a total amount during years 1850-2018 (left), and as recent annual amounts averaged for years 2009-2018 (right). These flows primarily occur through the emission sources and sinks of carbon dioxide (CO2), as color-coded and listed at the bottom of the figure.

Cumulative CO2 emissions during years 1850–2018 are estimated at 645±65 gigatonnes carbon (GtC). The largest sources are 440±20 GtC of geologic changes, primarily fossil fuels and cement, and 205±60 GtC of land use changes. The largest sinks are partitioned among the atmosphere (255±5 GtC; 40 %), ocean (160±20 GtC; 25 %), and land (195±40 GtC; 31 %). This cumulative land sink is broadly equal to the cumulative land use source, making global land near neutral over the 1850–2018 period. The use of nearly independent estimates for the individual terms shows a cumulative budget imbalance of 30 GtC (4 %) during 1850–2018.

Annual CO2 emissions during years 2009–2018 are estimated at about 11 GtC. The partitioning of sources and sinks remains similar to the cumulative amounts, with the exception that the relative contribution of the land source is about half the contribution of the land sink in recent years.

Credit:

Friedlingstein, P., Jones, M., O'Sullivan, M., Andrew, R., Hauck, J., Peters, G., Peters, W., Pongratz, J., Sitch, S., Le Quéré, C. and 66 others (2019) "Global carbon budget 2019". Earth System Science Data, 11(4): 1783–1838. doi:10.5194/essd-11-1783-2019. Material was copied from this source, which is available under a Creative Commons Attribution 4.0 International License.
Date
Source https://essd.copernicus.org/articles/11/1783/2019/
Author Pierre Friedlingstein, Matthew W. Jones, Michael O'Sullivan, et al.
Other versions

Licensing

w:en:Creative Commons
attribution
This file is licensed under the Creative Commons Attribution 4.0 International license.
You are free:
  • to share – to copy, distribute and transmit the work
  • to remix – to adapt the work
Under the following conditions:
  • attribution – You must give appropriate credit, provide a link to the license, and indicate if changes were made. You may do so in any reasonable manner, but not in any way that suggests the licensor endorses you or your use.

Captions

Anthropogenic carbon flows, showing cumulative mass from 1850-2018 (left) and annual mass average from 2009-2018 (right).

Items portrayed in this file

depicts

4 December 2019

image/png

7ccbfd01136dd91c2fd9a45c42aebca299aac1a5

160,466 byte

2,253 pixel

2,067 pixel

File history

Click on a date/time to view the file as it appeared at that time.

Date/TimeThumbnailDimensionsUserComment
current13:44, 8 March 2024Thumbnail for version as of 13:44, 8 March 20242,067 × 2,253 (157 KB)Capricorn4049Reverted to version as of 14:51, 27 October 2020 (UTC)
19:02, 5 March 2024Thumbnail for version as of 19:02, 5 March 20242,067 × 2,326 (165 KB)Prototyperspective2022
14:51, 27 October 2020Thumbnail for version as of 14:51, 27 October 20202,067 × 2,253 (157 KB)BikesrcoolUploaded a work by Pierre Friedlingstein, Matthew W. Jones, Michael O'Sullivan, et al. from https://essd.copernicus.org/articles/11/1783/2019/ with UploadWizard

The following 2 pages use this file:

Global file usage

The following other wikis use this file:

Metadata