Jump to content

File:Halflife-sim.gif

Page contents not supported in other languages.
This is a file from the Wikimedia Commons
From Wikipedia, the free encyclopedia

Halflife-sim.gif (100 × 188 pixels, file size: 17 KB, MIME type: image/gif, looped, 80 frames, 8.5 s)

Summary

Description
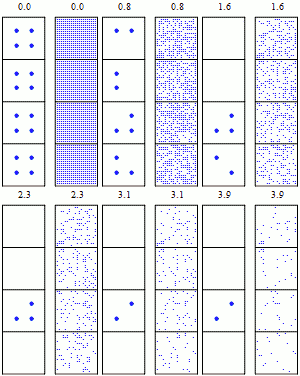
English: Simulation of many identical atoms undergoing radioactive decay, starting with either four atoms (left) or 400 atoms (right). The number at the top indicates how many half-lives have elapsed. Note the law of large numbers: With more atoms, the overall decay is less random. Image made with Mathematica, I am happy to send the source code if you would like to make this image more beautiful, or for any other reason.
Date
Source Own work
Author Sbyrnes321

Licensing

Public domain I, the copyright holder of this work, release this work into the public domain. This applies worldwide.
In some countries this may not be legally possible; if so:
I grant anyone the right to use this work for any purpose, without any conditions, unless such conditions are required by law.
(* Source code written in Mathematica 6.0, by Steve Byrnes, 2010. I release this code into the public domain. *)

SeedRandom[2]

(*Build list of point coordinates and radii*)

BuildCoordList[SqCenterX_, SqCenterY_, SqSide_, PtsPerRow_] := 
  Flatten[Table[{i, j}, {i, SqCenterX - SqSide/2, SqCenterX + SqSide/2, SqSide/(PtsPerRow - 1)},
     {j, SqCenterY - SqSide/2, SqCenterY + SqSide/2, SqSide/(PtsPerRow - 1)}], 1];

coordslist = Join[
   BuildCoordList[3.5, 1, 1.8, 20],
   BuildCoordList[3.5, 3, 1.8, 20],
   BuildCoordList[3.5, 5, 1.8, 20],
   BuildCoordList[3.5, 7, 1.8, 20],
   BuildCoordList[1, 1, .7, 2],
   BuildCoordList[1, 3, .7, 2],
   BuildCoordList[1, 5, .7, 2],
   BuildCoordList[1, 7, .7, 2]];
NumPts = Length[coordslist];
radiuslist = Join[Table[.03, {i, 1, 4*400}], Table[.1, {i, 1, 4*4}]];

(*Draw borders*)

xlist = {0, 2};
leftx = 0;
rightx = 2;
numx = Length[xlist];
ylist = {0, 2, 4, 6, 8};
topy = 0;
boty = 8;
numy = Length[ylist];
lines = {};
For[i = 1, i <= numy, i++, 
  lines = Append[lines, Line[{{leftx, ylist[[i]]}, {rightx, ylist[[i]]}}]]];
For[i = 1, i <= numx, i++, 
  lines = Append[lines, Line[{{xlist[[i]], topy}, {xlist[[i]], boty}}]]];

xlist = {2.5, 4.5};
leftx = 2.5;
rightx = 4.5;
numx = Length[xlist];
ylist = {0, 2, 4, 6, 8};
topy = 0;
boty = 8;
numy = Length[ylist];
For[i = 1, i <= numy, i++, 
  lines = Append[lines, Line[{{leftx, ylist[[i]]}, {rightx, ylist[[i]]}}]]];
For[i = 1, i <= numx, i++, 
  lines = Append[lines, Line[{{xlist[[i]], topy}, {xlist[[i]], boty}}]]];

(*Write numbers:
I want to be able to write a number with one decimal place,
including padding with ".0" when it's an integer.*)

WriteNum[num_] := Block[{rounded}, rounded = N[Floor[num, 0.1]];
    If[FractionalPart[rounded] == 0, ToString[rounded] <> "0", ToString[rounded]]];

(*Randomly choose decay times:
To get an expontial-decay-distributed random number, we pick a number uniformly between 0 and 1.
Take its negative log to get the time that it blows up, which is between 0 and infinity.
But divide by log 2 so that when the time = 1, there's 50% chance of decaying. *)

BlowTime = Table[-Log[RandomReal[]]/Log[2], {i, 1, NumPts}];

(*Draw graphics*)

GraphicsList = {};
NumFrames = 80;
TimePerFrame = .05;

Video = {};
For[frame = 1, frame <= NumFrames, frame++,
  CurrentTime = (frame - 1)*TimePerFrame;
  ImageGraphicsList = lines;
  ImageGraphicsList = 
   Append[ImageGraphicsList, Text[WriteNum[CurrentTime], {.8, 8.5}, {-1, 0}]];
  ImageGraphicsList = 
   Append[ImageGraphicsList, Text[WriteNum[CurrentTime], {3.3, 8.5}, {-1, 0}]];
  For[pt = 1, pt <= NumPts, pt++,
   If[CurrentTime < BlowTime[[pt]], 
    ImageGraphicsList =   Append[ImageGraphicsList, {Blue, Disk[coordslist[[pt]], radiuslist[[pt]]]}]]];
  Video = Append[Video, Graphics[ImageGraphicsList, ImageSize -> 100]];];

(*Pause at start*)
Video = Join[Table[Video[[1]], {i, 1, 5}], Video];

(*Export*)
Export["test.gif", Video, "DisplayDurations" -> {10}, "AnimationRepititions" -> Infinity ]

Captions

Add a one-line explanation of what this file represents

Items portrayed in this file

depicts

28 January 2010

File history

Click on a date/time to view the file as it appeared at that time.

Date/TimeThumbnailDimensionsUserComment
current19:41, 25 March 2010Thumbnail for version as of 19:41, 25 March 2010100 × 188 (17 KB)AiyizoOptimized animation, converted to 16 color mode
06:35, 5 February 2010Thumbnail for version as of 06:35, 5 February 2010100 × 188 (156 KB)Sbyrnes321Changed top-bottom split to left-right split, with space between; pause at start; 400 atoms in each crowded box instead of 296. (Thanks to Bdb484 for suggestions.)
00:26, 29 January 2010Thumbnail for version as of 00:26, 29 January 201061 × 131 (75 KB)Sbyrnes321{{Information |Description={{en|1=Simulation of many identical atoms undergoing radioactive decay. The number at the top indicates how many half-lives have elapsed. Note that after one half-life there are not ''exactly'' one-half of the atoms remaining, o

The following 3 pages use this file:

Global file usage

The following other wikis use this file: