
File:US2009FederalExpenditures.png
Size of this preview: 600 × 599 pixels. Other resolutions: 240 × 240 pixels | 481 × 480 pixels | 769 × 768 pixels | 1,025 × 1,024 pixels | 2,099 × 2,096 pixels.
Original file (2,099 × 2,096 pixels, file size: 107 KB, MIME type: image/png)
| This is a file from the Wikimedia Commons. Information from its description page there is shown below. Commons is a freely licensed media file repository. You can help. |
Summary
| Description |
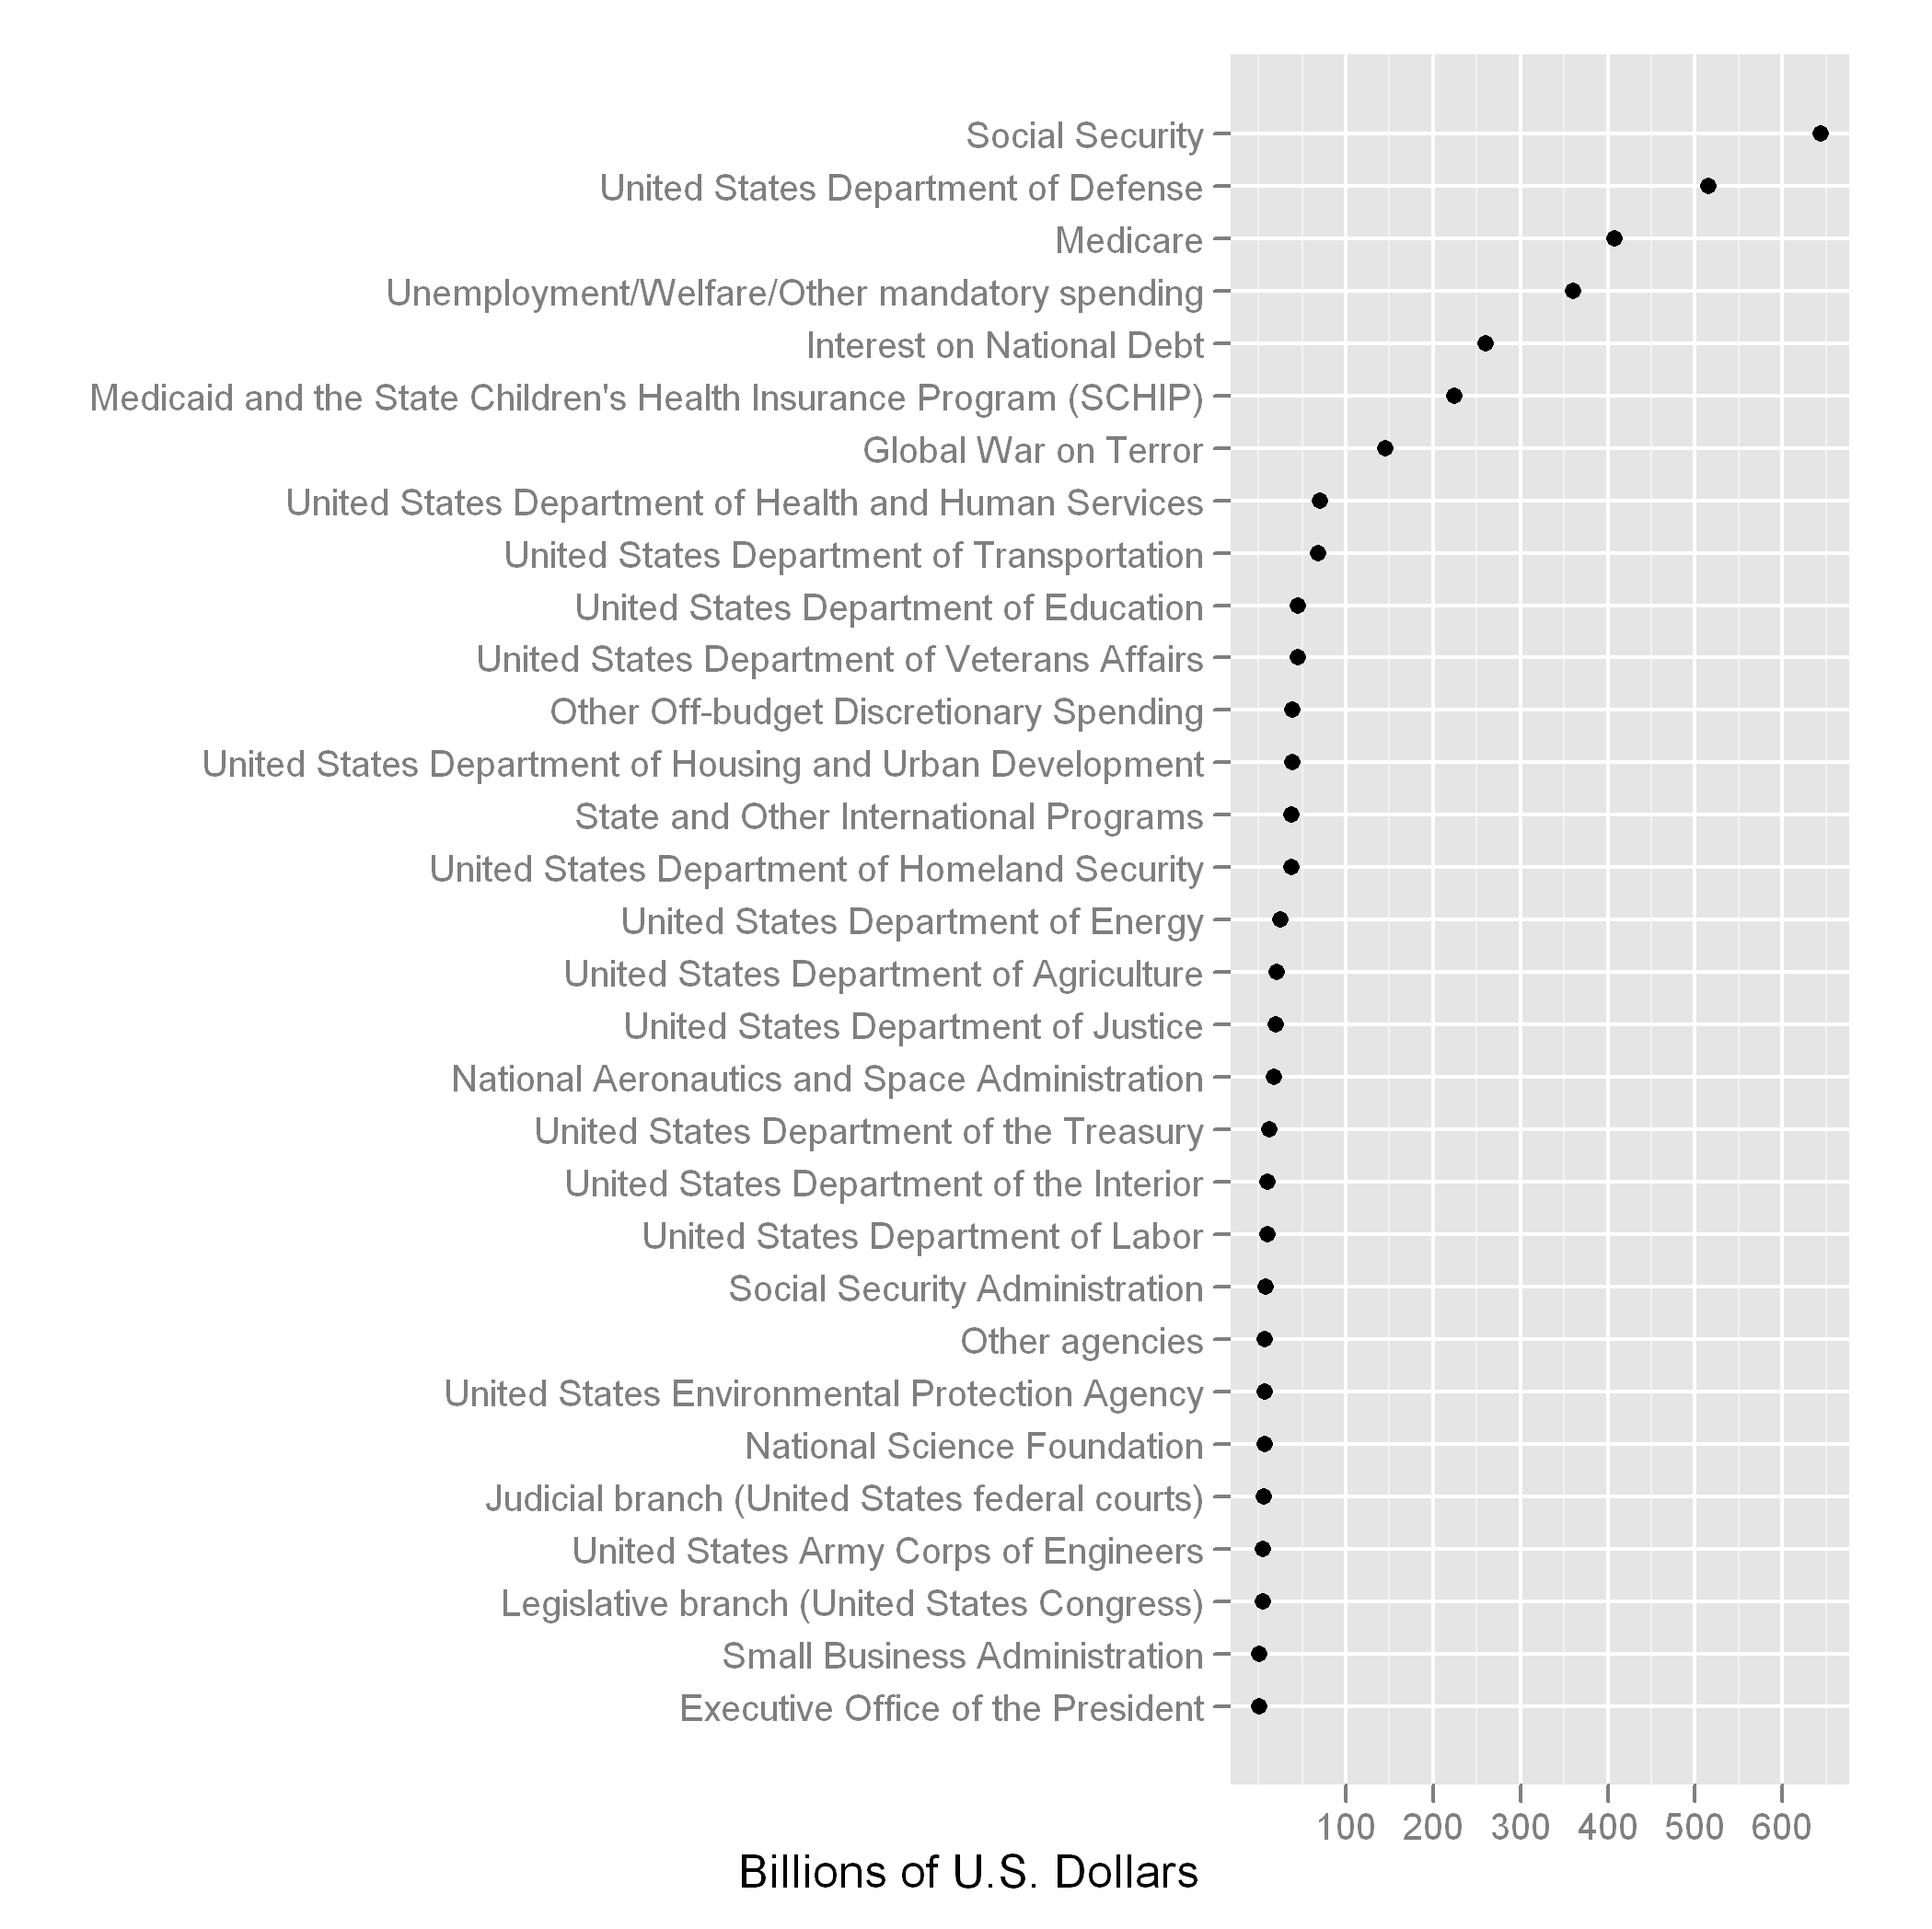
English: Dot plot of the total U.S. government budget in 2009, including both mandatory and discretionary. Taken from data at wikipedia:2009 United States federal budget. |
| Date | |
| Source | Own work |
| Author | Thopper |
| Other versions | File:Fy2009spendingbycategory2.png |
Creation Technique
General steps
- Compile data from list of budget items at wikipedia:2009 United States federal budget and save to a file (e.g. "2009expenditures.csv");
- Load data in R (programming language);
- Load the ggplot2 library;
- Assign the categorical variable (outlay) as a factor;
- Plot using the ggplot.
Compiling the data
- Compile the data into columns: one column for the budget expenditure (e.g. "Social Security," "Medicare," etc.) and the other for the amount ("644," "408," etc.).
- Name the columns "Expenditure" and "Billions" for the expenditure category and the amount (in billions of U.S. dollars), respectively.
- Save the data as comma-separated value file (csv).
R code to produce chart
# Load the ggplot2 library
library("ggplot2")

# Data saved using European separators ("." for thousands and "," for decimals), so use read.csv2().
# If data is saved using U.S. separators ("," for thousands and "." for decimals), use read.csv().
my.data <- read.csv2("2009expenditures.csv")

# Ensure that the categories are treated as factors
my.data <- data.frame(Billions = my.data$Billions, Expenditure = factor(my.data$Expenditure))

# Plot using ggplot2
ggplot(data = my.data, aes(Billions)) +
      geom_point(aes(y=reorder(Expenditure, Billions))) +
      xlab("Billions of U.S. Dollars") + ylab("")
Licensing
I, the copyright holder of this work, hereby publish it under the following license:
This file is licensed under the Creative Commons Attribution-Share Alike 3.0 Unported license.
- You are free:
- to share – to copy, distribute and transmit the work
- to remix – to adapt the work
- Under the following conditions:
- attribution – You must give appropriate credit, provide a link to the license, and indicate if changes were made. You may do so in any reasonable manner, but not in any way that suggests the licensor endorses you or your use.
- share alike – If you remix, transform, or build upon the material, you must distribute your contributions under the same or compatible license as the original.
File history
Click on a date/time to view the file as it appeared at that time.
| Date/Time | Thumbnail | Dimensions | User | Comment | |
|---|---|---|---|---|---|
| current | 14:34, 17 September 2010 | | 2,099 × 2,096 (107 KB) | Thopper | {{Information |Description={{en|1=Dot plot of the total U.S. government budget in 2009, including both mandatory and discretionary. Taken from data at wikipedia:2009 United States federal budget.}} |Source={{own}} |Author=Thopper |Dat |
File usage
The following page uses this file:
Global file usage
The following other wikis use this file: