Massachusetts's 2nd congressional district
| Massachusetts's 2nd congressional district | |
|---|---|
Interactive map of district boundaries since January 3, 2023 | |
| Representative | |
| Population (2023) | 798,884 |
| Median household income | $95,495[1] |
| Ethnicity |
|
| Cook PVI | D+13[2] |
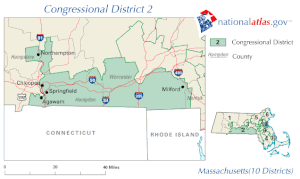
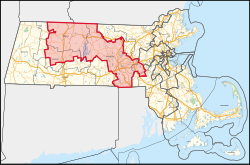
Massachusetts's 2nd congressional district is located in central Massachusetts, encompassing much of Franklin, Hampshire, and Worcester counties, as well as small portions of Middlesex and Norfolk Counties. The largest municipalities in the district include Worcester (which is the second-largest city in New England after Boston), Leominster, Amherst, Shrewsbury, and Northampton.
Democrat Jim McGovern has represented the district since 2013; he previously represented the 3rd district since 1997.
Cities and towns represented
[edit]As of the 2021 redistricting, the 2nd district includes 68 municipalities:[3]
Franklin County (22)
- Ashfield, Bernardston, Buckland, Colrain, Conway, Deerfield, Erving, Gill, Greenfield, Heath, Leverett, Leyden, Montague, New Salem, Northfield, Orange, Shelburne, Shutesbury, Sunderland, Warwick, Wendell, Whatley
Hampshire County (9)
Middlesex County (3)
Norfolk County (1)
Worcester County (33)
- Athol, Auburn, Barre, Boylston, Douglas, Grafton, Hardwick, Holden, Hubbardston, Leicester, Leominster, Millbury, Northborough, Northbridge, Oakham, Petersham, Paxton, Phillipston, Princeton, Royalston, Rutland, Shrewsbury, Southborough, Sterling, Sutton, Templeton, Upton, Uxbridge, Webster (part; also 1st), West Boylston, Westborough, Westminster (part; also 3rd), Worcester
History of District Boundaries
[edit]1795 to 1803
[edit]Known as the 2nd Western District.[4]
1803 to 1813
[edit]Known as the "Essex North" district.[4]
1813 to 1833
[edit]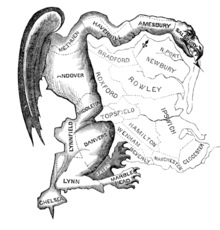
Known as the "Essex South" district.[4] From 1813-1815,[5] the district was shaped in such a way that poet and Federalist Richard Alsop described it as a "Gerry-mander" (a portmanteau of Gerry—the governor at the time—and salamander). Illustrator Elkanah Tisdale subsequently used the term as the basis for a political cartoon, which popularized it and led to "gerrymandering" being used to describe the practice of manipulating electoral district boundaries to gain a political advantage.[6]
1843 to 1853
[edit]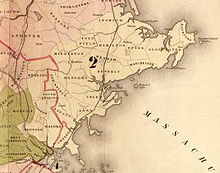
The Act of September 16, 1842, established the district on the North Shore and New Hampshire border, with the following municipalities:[7]
- In Essex County: Beverly, Danvers, Essex, Gloucester, Hamilton, Ipswich, Lynn, Lynnfield, Manchester, Marblehead, Middleton, Rockport, Salem, Saugus, Topsfield, and Wenham
- In Middlesex County: Malden, Medford, Reading, South Reading, and Stoneham
- In Suffolk County: Chelsea
1860s
[edit]"Parts of the counties of Bristol, Norfolk, and Plymouth."[8]
1870s–1900s
[edit]This section needs expansion. You can help by adding to it. (November 2013) |
1903 to 1913
[edit]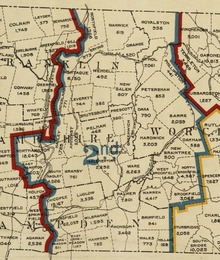
During this decade, the district contained the following municipalities:[9]
- In Franklin County: Erving, Leverett, Montague, New Salem, Northfield, Orange, Shutesbury, Sunderland, Warwick, and Wendell
- In Hampshire County: Amherst, Belchertown, Easthampton, Enfield, Granby, Hadley, Northampton, Pelham, Prescott, South Hadley, and Ware
- In Hampden County: Brimfield, Chicopee, East Longmeadow, Hampden, Holland, Longmeadow, Ludlow, Monson, Palmer, Springfield, Wales, and Wilbraham
- In Worcester County: Athol, Barre, Brookfield, Dana, Hardwick, New Braintree, North Brookfield, Oakham, Petersham, Phillipston, Royalston, Warren, and West Brookfield.
1913 to 1923
[edit]During this decade, the district contained the following municipalities:[10]
- In Franklin County: Bernardston, Deerfield, Erving, Gill, Leverett, Montague, Northfield, Shutesbury, Sunderland, Warwick, Wendell, and Whately
- In Hampshire County: Amherst, Belchertown, Easthampton, Enfield, Granby, Hadley, Hatfield, Northampton, Pelham, South Hadley, Ware, and Williamsburg
- In Hampden County: Agawam, Chicopee, East Longmeadow, Hampden, Longmeadow, Ludlow, Springfield, West Springfield, and Wilbraham
1920s–2002
[edit]This section needs expansion. You can help by adding to it. (November 2013) |
2003 to 2013
[edit]
During this decade, the district contained the following municipalities:
- In Hampden County: Agawam, Brimfield, Chicopee, East Longmeadow, Hampden, Holland, Longmeadow, Ludlow, Monson, Palmer, Springfield, Wales, Wilbraham
- In Hampshire County: Hadley, Northampton, South Hadley
- In Norfolk County: Bellingham
- In Worcester County: Blackstone, Brookfield, Charlton, Douglas, Dudley, East Brookfield, Grafton, Hopedale, Leicester, Mendon, Milford, Millbury, Millville, North Brookfield, Northbridge, Oxford, Southbridge, Spencer, Sturbridge, Sutton, Upton, Uxbridge, Warren, Webster
2013 to 2023
[edit]After the 2010 census, the shape of the district changed for the elections of 2012. The updated district covered central Massachusetts, including much of Worcester County, and was largely the successor to the old 3rd District. Most of the old 2nd district, including Springfield, was moved into the updated 1st district.
During this decade, the district contained the following municipalities:[11]
- In Franklin County: Deerfield, Erving, Gill, Greenfield, Leverett, Montague, New Salem, Northfield, Orange, Shutesbury, Sunderland, Wendell, Warwick, and Whately
- In Hampden County: Precinct 1 in Palmer
- In Hampshire County: Amherst, Belchertown, Hadley, Hatfield, Northampton, Pelham, and Ware
- In Norfolk County: Precincts 4 and 5 in Bellingham
- In Worcester County: Athol, Auburn, Barre, Blackstone, Boylston, Douglas, Grafton, Hardwick, Holden, Hubbardston, Leicester, Leominster, Mendon, Millbury, Millville, Northborough, Northbridge, North Brookfield, Oakham, Oxford, Paxton, Petersham, Phillipston, Princeton, Royalston, Rutland, Shrewsbury, Spencer, Sterling, Sutton, Templeton, Upton, Uxbridge, Webster, West Boylston, Westborough, Precinct 1 in Winchendon, and Worcester.
Recent election results from statewide races
[edit]| Year | Office | Results[12] |
|---|---|---|
| 2008 | President | Obama 61% - 37% |
| 2012 | President | Obama 61% - 39% |
| 2014 | Senate | Markey 58% - 42% |
| Governor | Baker 50% - 44% | |
| 2016 | President | Clinton 58% - 34% |
| 2018 | Senate | Warren 59% - 37% |
| Governor | Baker 68% - 32% | |
| Attorney General | Healey 68% - 32% | |
| 2020 | President | Biden 64% - 33% |
| Senate | Markey 64% - 34% | |
| 2022 | Governor | Healey 63% - 35% |
| Secretary of the Commonwealth | Galvin 66% - 30% | |
| Attorney General | Campbell 62% - 38% | |
| Treasurer and Receiver-General | Goldberg 75% - 25% | |
| Auditor | DiZoglio 53% - 39% |
List of members representing the district
[edit]Recent election results
[edit]1988
[edit]| Party | Candidate | Votes | % | |
|---|---|---|---|---|
| Democratic | Richard Neal | 156,262 | 80.23 | |
| Republican | Louis R. Godena | 38,446 | 19.74 | |
| Write-in | 52 | 0.01 | ||
| Majority | 117,816 | 60.40 | ||
| Turnout | ||||
| Democratic hold | ||||
1990
[edit]| Party | Candidate | Votes | % | ±% | |
|---|---|---|---|---|---|
| Democratic | Richard Neal (Incumbent) | 134,152 | 67.99 | −12.24 | |
| Write-in | 63,169 | 32.01 | +32.00 | ||
| Majority | 70,983 | 35.98 | −24.42 | ||
| Turnout | 197,321 | ||||
| Democratic hold | Swing | ||||
1992
[edit]| Party | Candidate | Votes | % | ±% | |
|---|---|---|---|---|---|
| Democratic | Richard Neal (Incumbent) | 131,215 | 53.09 | −14.90 | |
| Republican | Anthony W. Ravosa, Jr. | 76,795 | 31.07 | +31.07 | |
| Independent | Thomas R. Sheehan | 38,963 | 15.76 | +15.76 | |
| Write-in | 190 | 0.07 | −31.94 | ||
| Majority | 54,420 | 22.02 | −13.96 | ||
| Turnout | 247,163 | ||||
| Democratic hold | Swing | ||||
1994
[edit]| Party | Candidate | Votes | % | ±% | |
|---|---|---|---|---|---|
| Democratic | Richard Neal (Incumbent) | 117,178 | 58.55 | +5.46 | |
| Republican | John M. Briare | 72,732 | 36.34 | +5.27 | |
| Natural Law | Kate Ross | 10,167 | 5.08 | +5.08 | |
| Write-in | 46 | 0.02 | −0.05 | ||
| Majority | 44,446 | 22.21 | +0.19 | ||
| Turnout | 200,123 | ||||
| Democratic hold | Swing | ||||
1996
[edit]| Party | Candidate | Votes | % | ±% | |
|---|---|---|---|---|---|
| Democratic | Richard Neal (Incumbent) | 162,995 | 71.67 | +13.12 | |
| Republican | Mark Steele | 49,885 | 21.94 | −14.40 | |
| Independent | Scott Andrichak | 9,181 | 4.04 | +4.04 | |
| Natural Law | Richard Kaynor | 5,124 | 2.25 | −2.83 | |
| Write-in | 226 | 0.10 | +0.08 | ||
| Majority | 113,110 | 49.74 | +27.53 | ||
| Turnout | 227,411 | ||||
| Democratic hold | Swing | ||||
1998
[edit]| Party | Candidate | Votes | % | ±% | |
|---|---|---|---|---|---|
| Democratic | Richard Neal (Incumbent) | 130,550 | 98.95 | +27.28 | |
| Write-in | 1,383 | 1.05 | +0.95 | ||
| Majority | 129,167 | 97.90 | +48.16 | ||
| Turnout | 131,933 | ||||
| Democratic hold | Swing | ||||
2000
[edit]| Party | Candidate | Votes | % | ±% | |
|---|---|---|---|---|---|
| Democratic | Richard Neal (Incumbent) | 196,670 | 98.91 | −0.04 | |
| Write-in | 2,176 | 1.09 | +0.04 | ||
| Majority | 194,494 | 97.81 | −0.09 | ||
| Turnout | 253,867 | ||||
| Democratic hold | Swing | ||||
2002
[edit]| Party | Candidate | Votes | % | ±% | |
|---|---|---|---|---|---|
| Democratic | Richard Neal (Incumbent) | 153,387 | 99.13 | +0.22 | |
| Write-in | 1,341 | 0.87 | −0.22 | ||
| Majority | 152,046 | 98.26 | +0.45 | ||
| Turnout | 208,498 | ||||
| Democratic hold | Swing | ||||
2004
[edit]| Party | Candidate | Votes | % | ±% | |
|---|---|---|---|---|---|
| Democratic | Richard Neal (Incumbent) | 217,682 | 98.96 | −0.17 | |
| Write-in | 2,282 | 1.04 | +0.17 | ||
| Majority | 227,183 | 97.92 | −0.34 | ||
| Turnout | 287,871 | ||||
| Democratic hold | Swing | ||||
2006
[edit]| Party | Candidate | Votes | % | ±% | |
|---|---|---|---|---|---|
| Democratic | Richard Neal (Incumbent) | 164,939 | 98.65 | −0.31 | |
| Write-in | 2,254 | 1.35 | +0.31 | ||
| Majority | 162,685 | 97.30 | −0.62 | ||
| Turnout | 214,939 | ||||
| Democratic hold | Swing | ||||
2008
[edit]| Party | Candidate | Votes | % | ±% | |
|---|---|---|---|---|---|
| Democratic | Richard Neal (Incumbent) | 234,369 | 98.47 | −0.18 | |
| Write-in | 3,631 | 1.53 | +0.18 | ||
| Majority | 230,738 | 96.95 | −0.35 | ||
| Turnout | 306,820 | ||||
| Democratic hold | Swing | ||||
2010
[edit]| Party | Candidate | Votes | % | ±% | |
|---|---|---|---|---|---|
| Democratic | Richard Neal (Incumbent) | 122,751 | 57.33 | −41.14 | |
| Republican | Thomas A. Wesley | 91,209 | 42.60 | +42.60 | |
| Write-in | 164 | 0.08 | −1.45 | ||
| Majority | 31,542 | 14.73 | −82.12 | ||
| Turnout | 220,424 | ||||
| Democratic hold | Swing | ||||
2012
[edit]| Party | Candidate | Votes | % | |
|---|---|---|---|---|
| Democratic | Jim McGovern (Incumbent) | 259,257 | 98.5 | |
| Write-in | 4,078 | 1.5 | ||
| Total votes | 263,335 | 100 | ||
| Turnout | ||||
| Democratic hold | ||||
2014
[edit]| Party | Candidate | Votes | % | |
|---|---|---|---|---|
| Democratic | Jim McGovern (Incumbent) | 169,640 | 98.20 | |
| Write-in | 3,105 | 1.80 | ||
| Total votes | 172,745 | 100 | ||
| Democratic hold | ||||
2016
[edit]| Party | Candidate | Votes | % | |
|---|---|---|---|---|
| Democratic | Jim McGovern (Incumbent) | 275,487 | 98.24 | |
| Write-in | 4,924 | 1.76 | ||
| Total votes | 280,411 | 100 | ||
| Democratic hold | ||||
2018
[edit]| Party | Candidate | Votes | % | |
|---|---|---|---|---|
| Democratic | Jim McGovern (incumbent) | 191,332 | 67.2% | |
| Republican | Tracy Lovvorn | 93,391 | 32.8% | |
| Independent | Paul Grady | |||
| Total votes | 293,163 | |||
2020
[edit]| Party | Candidate | Votes | % | |
|---|---|---|---|---|
| Democratic | Jim McGovern (incumbent) | 249,854 | 65.3% | |
| Republican | Tracy Lovvorn | 132,220 | 34.6% | |
| Write-in | 378 | 0.1 | ||
| Total votes | 382,452 | |||
References
[edit]- ^ "My Congressional District".
- ^ "2022 Cook PVI: District Map and List". Cook Political Report. July 12, 2022. Retrieved January 10, 2023.
- ^ "Massachusetts Congressional Districts". Secretary of the Commonwealth of Massachusetts.
- ^ a b c "MA - District 02 - History". Our Campaigns. September 10, 2013. Retrieved February 11, 2012.
- ^ "MA District 2 (Essex South)". Our Campaigns. April 14, 2011.
- ^ Trickey, Erick (July 20, 2017). "Where Did the Term "Gerrymander" Come From?". Smithsonian Magazine.
- ^ "State Apportionment; districts of the Commonwealth for the choice of one representative to Congress in each district". Massachusetts Register ... for 1843. Boston: Loring. 1779.
- ^ a b Ben. Perley Poore (1869). "Massachusetts". Congressional Directory for the First Session of the Forty-First Congress (2nd ed.). Washington DC: Government Printing Office. hdl:2027/nyp.33433081796686.
- ^ "Massachusetts". Official Congressional Directory: 59th Congress (2nd ed.). Washington DC: Government Printing Office. 1905.
- ^ "Massachusetts". Official Congressional Directory: 64th Congress (2nd ed.). Washington DC: Government Printing Office. 1916. hdl:2027/uc1.l0075858456.
- ^ "The Commonwealth of Massachusetts: Congressional Districts, Chapter 177 of the Acts of 2011".
- ^ https://davesredistricting.org/maps#viewmap::791f8174-e00d-4baf-9b0a-206a298eb28b
- ^ "Massachusetts". Congressional Directory for the Second Session of the Thirty-Seventh Congress. Washington DC: House of Representatives. 1861.
- ^ Ben. Perley Poore (1878). "Massachusetts". Congressional Directory: 45th Congress (3rd ed.). Washington DC: Government Printing Office. ISBN 978-0-16-041176-2.
- ^ Ben. Perley Poore (1882). "Massachusetts". Congressional Directory: 47th Congress (3rd ed.). Washington DC: Government Printing Office.
- ^ L.A. Coolidge (1897). "Massachusetts". Official Congressional Directory: Fifty-Fifth Congress. Washington DC: Government Printing Office.
- ^ A.J. Halford (1909). "Massachusetts". Congressional Directory: 60th Congress (2nd ed.). Washington DC: Government Printing Office.
- ^ "Massachusetts". Official Congressional Directory: 75th Congress (2nd ed.). Washington DC: Government Printing Office. 1938.
- ^ "Massachusetts". Official Congressional Directory: 90th Congress. Washington DC: Government Printing Office. 1968.
- ^ "Massachusetts". 1991-1992 Official Congressional Directory: 102nd Congress. Washington DC: Government Printing Office. 1991.
- ^ "Return of Votes for Massachusetts State Elections, November 6, 2013" (PDF). Secretary of State for the Commonwealth of Massachusetts. November 23, 2012. Retrieved June 1, 2013.
- ^ The totals do not include Blank/Scatterings Ballots although they were reported.
- ^ "Massachusetts Secretary of State Election Results 2014" (PDF). Massachusetts Secretary of State. November 4, 2014. Retrieved December 26, 2014.
- ^ "Massachusetts Secretary of State General Election Results 2016". Massachusetts Secretary of State. November 8, 2016. Retrieved December 15, 2016.
- Martis, Kenneth C. (1989). The Historical Atlas of Political Parties in the United States Congress. New York: Macmillan Publishing Company.
- Martis, Kenneth C. (1982). The Historical Atlas of United States Congressional Districts. New York: Macmillan Publishing Company.
- Congressional Biographical Directory of the United States 1774–present
External links
[edit]- CNN.com 2004 election results
- CNN.com 2006 election results
- Map of Massachusetts's 2nd Congressional District, 2003–2013, via Massachusetts Secretary of the Commonwealth
- Rose Institute of State and Local Government, "Massachusetts: 2010 Redistricting Changes: Second District", Redistricting by State, Claremont, CA: Claremont McKenna College, archived from the original on September 15, 2020
- "Our Campaigns - United States - Massachusetts - MA - District 02". www.ourcampaigns.com. Retrieved December 31, 2020.
- Congressional districts of Massachusetts
- Springfield, Massachusetts
- Government of Hampden County, Massachusetts
- Government of Hampshire County, Massachusetts
- Government of Norfolk County, Massachusetts
- Government in Worcester County, Massachusetts
- Princeton, Massachusetts
- 1789 establishments in Massachusetts
- Constituencies established in 1789


